Hardscaping Industry Statistics & Data (2026)
Twenty years now, hardscapes have made up most of my work on Northeast Ohio. Numbers capture how much things shifted — harder to explain from experience. These days, fewer people keep their best living space inside walls. Out back, under roofs that rise from ground, becomes common ground.
Nowhere has material choice grown faster. Big projects now fill the schedule like never before.
Over there, you’ll find the numbers I follow — ones I pull from time to time, then pass along to people curious about what comes next before signing up for anything. Homeowners dipping into backyard ideas for the very first time might see these figures. So might workers across the field who compare current shifts against past patterns. These points capture movement as it happens.
Here's something you might not know about hardscaping. Check out our complete guide to hardscaping first, then return to this page for the details, including figures.
Market Size & Growth
The U.S. outdoor living market — which includes hardscaping, landscape construction, outdoor furniture, and related categories — reached an estimated $32–$35 billion in 2025, according to industry analyses from market research firms tracking residential construction spending.
Key market figures:
| Metric | Estimate |
|---|---|
| U.S. outdoor living market size (2025) | $32–$35 billion |
| Residential hardscaping share | ~40–45% of total outdoor living |
| Estimated residential hardscape market | $13–$16 billion |
| Annual growth rate (2020–2026) | 5–7% CAGR |
| Projected market size (2028) | $42–$48 billion |
The residential segment drives the bulk of hardscape spending. Commercial and municipal projects (parking lots, public plazas, streetscapes) are significant but grow at a slower rate. Residential demand has been the engine since 2020, when homeowners began reinvesting heavily in their properties — a trend that outlasted the pandemic-era surge and has settled into sustained growth.
What's pushing growth:
- Homeowners treating outdoor space as functional living area, not just yard
- Rising home values making renovation investment more justifiable
- Aging housing stock requiring hardscape replacement and upgrades
- Material innovation expanding design possibilities (large-format pavers, porcelain, permeable systems)
- Remote and hybrid work keeping people home more, increasing demand for usable outdoor space
The Interlocking Concrete Pavement Institute (ICPI) has tracked growing adoption of segmental pavement systems for over two decades, and the acceleration since 2020 has been the most significant in the industry's modern history.
Homeowner Spending Data
What are homeowners actually paying for hardscape projects? These figures align with what we see across our builds in Northeast Ohio and national survey data from remodeling industry reports.
Average project costs by type:
| Project Type | National Average Range | Northeast Ohio Range |
|---|---|---|
| Paver patio (400–600 sqft) | $15,000–$35,000 | $12,000–$28,000 |
| Stamped concrete patio | $8,000–$20,000 | $7,000–$18,000 |
| Retaining wall (structural) | $5,000–$15,000 | $4,000–$13,000 |
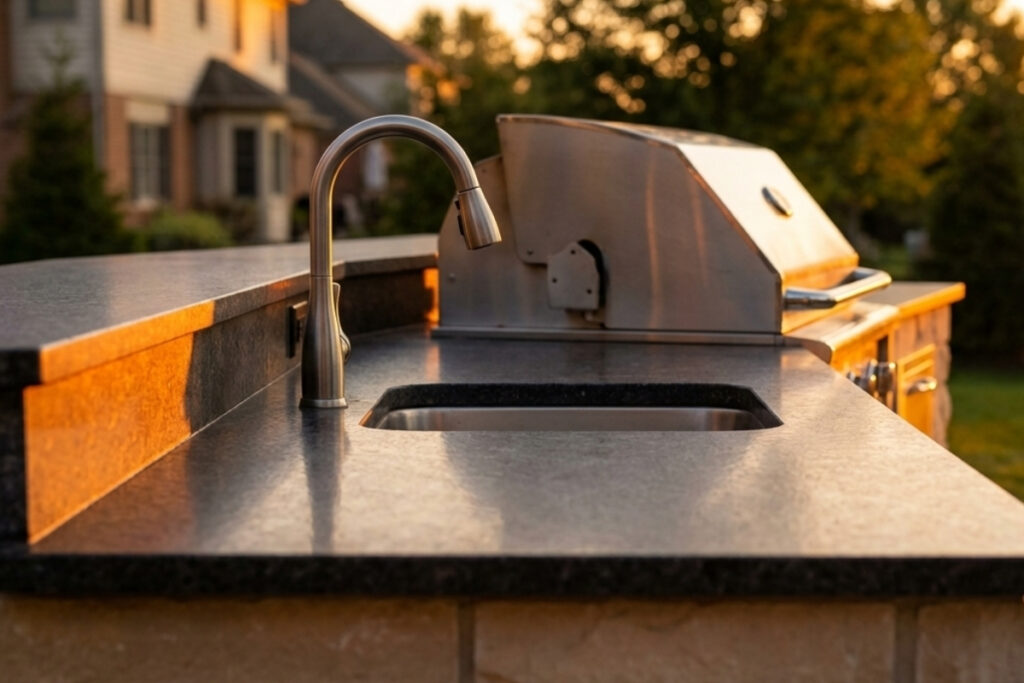
| Outdoor kitchen (complete) | $15,000–$70,000+ | $20,000–$60,000+ |
| Fire pit (built-in, custom) | $3,000–$12,000 | $3,500–$10,000 |
| Complete outdoor living project | $40,000–$100,000+ | $30,000–$85,000+ |
For a detailed breakdown of what drives those numbers locally, see our hardscaping cost guide for Northeast Ohio.
Spending trends worth noting:
- Average hardscape project size has increased ~25% since 2019. Homeowners are building bigger — larger patio surfaces, more integrated features, multi-zone designs.
- Multi-feature projects are the norm, not the exception. The standalone patio is becoming less common. Most projects now include at least two additional elements: fire feature, seat walls, walkways, outdoor kitchen, or lighting.
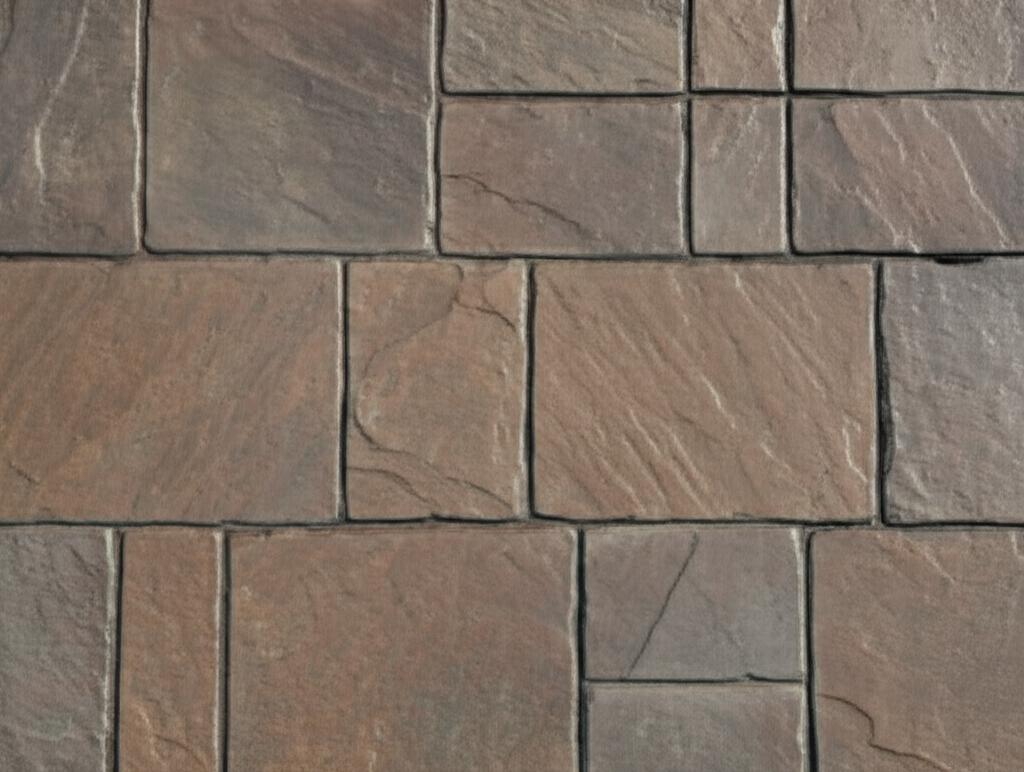
- Material upgrades are accelerating. Homeowners are choosing mid-range and premium pavers over entry-level products at a higher rate than five years ago. Large-format and textured pavers now account for an estimated 35–40% of residential paver sales, up from under 20% in 2019.
Material Trends & Market Share
Not all hardscape materials are created equal — and the market data shows clear preferences.
Residential hardscape material market share (estimated 2025–2026):
| Material | Market Share | Trend |
|---|---|---|
| Concrete pavers (interlocking) | ~60% | Stable, slight growth |
| Stamped/poured concrete | ~18% | Declining slowly |
| Natural stone | ~12% | Growing steadily |
| Porcelain pavers | ~5% | Fastest-growing segment |
| Brick | ~3% | Declining |
| Other (gravel, permeable, composite) | ~2% | Emerging |
Concrete pavers dominate — and for good reason. They handle freeze-thaw climates, they're individually replaceable, and manufacturers like Unilock and Belgard have invested heavily in textures and formats that rival natural stone aesthetics at a lower price point. The ICPI's installation standards give contractors and homeowners a quality benchmark that doesn't exist for most other materials.
Porcelain is the story to watch. Five years ago, porcelain pavers were a niche product. Now they're the fastest-growing material category in residential hardscaping. Near-zero water absorption makes them essentially freeze-thaw proof. They don't stain. And the large-format sizes (up to 24×48 inches) create a modern, minimal-joint look that concrete pavers can't replicate at the same scale.
Stamped concrete is losing share. The maintenance burden (resealing every 2–3 years), cracking inevitability, and inability to spot-repair are pushing homeowners toward pavers and natural stone. Stamped concrete still wins on initial price — but the total cost of ownership over 15–20 years narrows that gap considerably.
Natural stone is growing in the premium segment. Bluestone, limestone, and granite remain the top choices for homeowners willing to pay the premium. Natural stone's share is growing not because it's getting more affordable but because more homeowners are willing to invest in it.

ROI & Property Value Impact
This is the data that matters most to homeowners weighing a significant investment. The National Association of Realtors (NAR) tracks remodeling impact across categories, and outdoor living improvements consistently rank among the highest for both cost recovery and homeowner satisfaction.
ROI data for hardscape improvements:
| Improvement | Estimated Cost Recovery at Resale | Homeowner "Joy Score" |
|---|---|---|
| Patio addition | 50–75% | 9.4/10 |
| Outdoor kitchen | 55–70% | 9.2/10 |
| Fire feature | 50–65% | 9.5/10 |
| Walkway/entrance upgrade | 60–80% | 8.8/10 |
| Retaining wall (functional) | 50–60% | 7.5/10 |
A few things the raw ROI numbers don't capture:
- Perceived value exceeds appraised value. NAR data consistently shows that homeowners believe outdoor improvements add more value than appraisers assign. That gap matters — it means buyers respond emotionally to outdoor living spaces in ways that move purchase decisions even if the number doesn't show up dollar-for-dollar in the appraisal.
- Joy scores are among the highest of any home improvement. Outdoor projects regularly outperform kitchen and bathroom remodels on homeowner satisfaction. A patio with a fire pit scores higher than a minor kitchen renovation on happiness metrics. That tracks with what our clients tell us years after their projects are finished.
- Homes with professional hardscaping sell faster. Multiple real estate studies indicate that properties with well-maintained outdoor living spaces spend fewer days on market than comparable homes without them — particularly in suburban markets where outdoor entertaining is expected.
For specific project cost data behind these ROI figures, see our patio cost guide for Cleveland.
Regional Data: Northeast Ohio
National statistics tell one story. Here in Northeast Ohio, we have our own data points.
Climate-driven considerations:
- 36 inches of frost penetration depth. This dictates base construction depth and rules out shortcuts that work in warmer regions. Our base construction runs 8+ inches of compacted aggregate — nearly double what's standard in the southern U.S.
- 39 inches of average annual rainfall. Every hardscape project in this region is a drainage project. Clay soil that holds water makes proper grading, catch basins, and pipe runs non-negotiable.
- 70+ freeze-thaw cycles per year. This is the stat that matters most for material selection. Concrete pavers with low absorption rates and flexible joints handle this. Poured concrete does not — it cracks. Period.
Local market context:
- Cleveland metro median home values have increased steadily since 2020, making renovation investment more attractive from a property value standpoint.
- Cuyahoga, Medina, and Lorain counties have a large inventory of homes built in the 1960s–1990s with aging or nonexistent hardscaping — driving replacement and upgrade demand.
- Skilled hardscape labor remains tight in Northeast Ohio. Wait times for reputable contractors run 4–8 weeks during peak season, and that timeline has grown each of the last three years.
Seasonal Patterns
When do homeowners think about hardscaping? When do they buy? When do projects get built? The data follows a predictable pattern.
Annual cycle:
| Period | Activity |
|---|---|
| January–February | Research peaks. Homeowners start searching for ideas, costs, and contractors. |
| March–April | Design consultations. Contracts signed. Material selections finalized. |
| April–May | Construction season opens. Frost clears, ground is workable. |
| June–August | Peak construction. Longest days, best weather, highest demand. |
| September–October | Second wave of starts. Great building weather, lower demand. |
| November–December | Construction slows. Ground freezes. Planning for next season begins. |
Why this matters for homeowners: If you want a spring start, begin the conversation in January or February. Our design and scheduling calendar fills early. Calling in May typically means a July or August start. Projects contracted in September and October often get the best scheduling flexibility.
Google Trends data confirms the pattern. Search volume for terms like "patio installation," "paver patio cost," and "outdoor kitchen" spikes in March and peaks in May, then gradually declines through fall. Smart homeowners who research in winter get ahead of the curve.
Industry Workforce & Certification
The hardscape industry faces the same skilled labor challenges as most construction trades. And the numbers tell a clear story.
Workforce statistics:
- The construction industry broadly has faced a skilled labor shortage exceeding 500,000 workers nationally, per Associated General Contractors of America reports.
- Hardscaping is a specialized subset — not every construction worker can build a paver patio to ICPI standards or engineer a retaining wall to NCMA specs.
- Certified installers (ICPI and NCMA certifications) represent a minority of working hardscape contractors. Certification requires training, testing, and continuing education.
- Companies with certified crews report lower callback rates and higher client satisfaction.
What this means in practice: There are more people offering hardscape installation than there are people qualified to do it well. Certification isn't a guarantee of quality, but it indicates a contractor who invested time in learning industry standards rather than figuring it out on the job.
Labor cost trends:
- Skilled hardscape labor rates in Northeast Ohio run $50–$70 per man-hour (loaded cost including insurance, equipment, overhead).
- Rates have increased 15–20% since 2020, driven by labor scarcity and rising insurance and fuel costs.
- These increases are baked into project pricing — which is part of why the "same patio" costs more in 2026 than it did in 2021.
What This Means for Homeowners
Now that you have the data, what happens next? These steps show how to move forward.
A shift in outdoor design has created space for fresh choices – yet needs keep rising too. With rising interest in hardscapes comes a wider range of materials, opening doors to different looks and layouts. This surge draws in more pros able to bring these visions to life. Still, lines grow faster than supply, leaving some waiting longer than before. Costs climb alongside demand, making everything feel heavier on the wallet. Thinking early helps shape a stronger schedule plus extra moments to weigh design choices.
Nowhere is the difference clearer than in materials, where low-end picks once felt similar to high-end ones. Yet today’s gap is harder to ignore. What stands behind each option needs attention, simply because weighing performance against cost takes more effort than before. Starting low does not mean ending up ahead when it comes to 15 to 20 year costs.
A payoff shows up, sure – hardscaping brings returns. Yet what lifts daily life even more stands beyond numbers. A backyard space might boost your home’s worth later. Yet its true worth shows when years pass and people actually live within it – numbers miss that part.
Hire people who meet high standards, even if they are hard to find. Workforce numbers show a lack of trained, certified hardscape workers. Instead of picking based on who’s around, confirm your contractor knows what they’re doing. Look into how they build hardscapes, not just take their word. Ask questions about drainage designs too – good ones plan ahead. That kind of care makes a difference later. A strong build now means fewer problems down the road.
5. Start early. Every season shows its pattern clearly. When homeowners start early during cold months, they secure better schedules, allow space for design work, and carry less tension compared to people reaching out in late spring hoping for quick summer installs.
Starting something new? Over at Greater Cleveland, Medina County, and Lorain County, we lay down hardscapes using solid groundwork – drainage designs too – and know which materials hold up. Request your design consultation – that’s where we meet. What’s on your mind?
Built by Bee Green Outdoor Living, the professional hardscaping sit in Northeast Ohio. Figures here come from business reports, group statements, remodeling studies, plus work done over twenty years. The latest version was refreshed by 2026.