What Homeowners Actually Choose: Patio Installation Data
Twenty years worth of building patios — hundreds across the region — have shown one clear pattern. What people pick isn’t found in glossy mags or scrolled through online. Trends come and go; their real-world results stay steady.
Most times, people care more about their own space when it’s actually theirs to fix or choose.
That is me, Jesse Russell, running Bee Green Outdoor Living at Columbia Station, Ohio. Each time a job finishes, details go on record — what stuff was used, how big things are, what made them special, how much it cost, when it got done. With decades behind us now, this collection shows things in ways those shiny vendor handouts can’t match. This is how that tale unfolds.
Material Choices: What Homeowners Actually Pick
Ask ten homeowners what they want and you'll hear "pavers" more often than anything else. The numbers back that up.
| Material | % of Projects |
|---|---|
| Concrete pavers | 58% |
| Natural stone (bluestone, flagstone) | 18% |
| Stamped concrete | 14% |
| Porcelain pavers | 7% |
| Other (brick, travertine) | 3% |
Concrete pavers dominate for good reason. Northeast Ohio's freeze-thaw cycles are brutal — we can swing 50 degrees in a single week. Pavers flex with that movement instead of cracking. And if one does crack or settle? You pull it out and replace it. Try that with a stamped concrete slab.
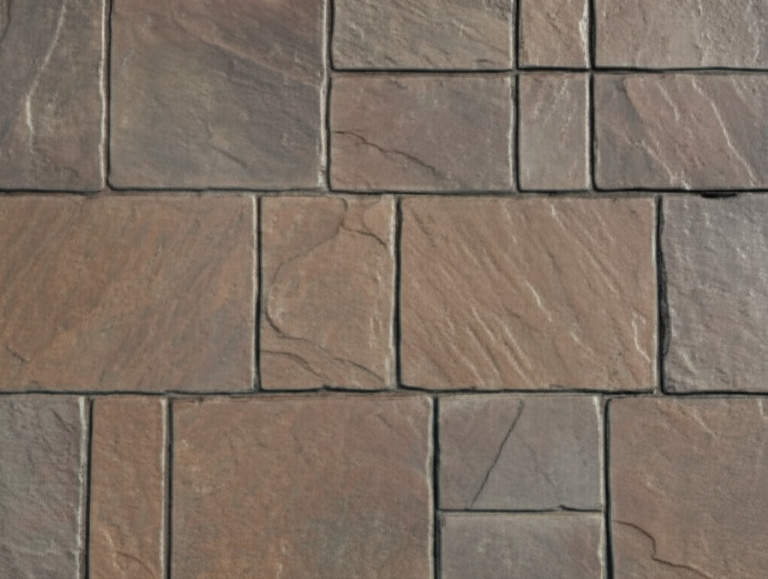
Natural stone holds steady at about 18%. Bluestone and flagstone appeal to homeowners going for that classic, organic look, especially on properties with established gardens. Stamped concrete still has a following, though we've watched that number drop over the past five years as homeowners learn more about long-term maintenance and the differences between stamped concrete and pavers.
Porcelain pavers are the newcomer. Seven percent might sound small, but that number was basically zero five years ago. The Interlocking Concrete Pavement Institute (ICPI) has noted the rise in porcelain paver adoption across the industry, and we're seeing the same trend locally.
Project Sizes: How Big Do People Actually Go?
This one surprises people. The average patio we build comes in at about 450 square feet — bigger than most homeowners initially picture.
| Size Range | % of Projects | Typical Use |
|---|---|---|
| Under 200 sq ft | 8% | Small landing or entryway pad |
| 200–400 sq ft | 32% | Dining patio with table seating |
| 400–600 sq ft | 35% | Multi-use patio (dining + lounge) |
| 600–800 sq ft | 16% | Large entertaining space |
| 800+ sq ft | 9% | Full outdoor living area |
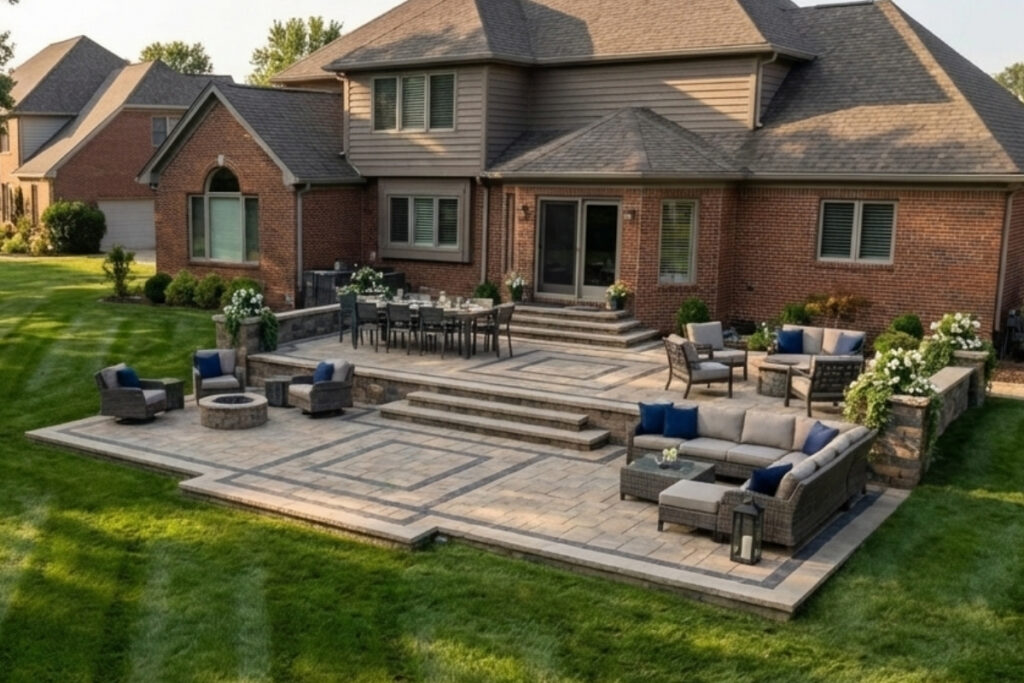
The sweet spot? 400 to 600 square feet. That gives you room for a dining set, a conversation area, maybe a built-in fire pit. It's the size where a patio stops feeling like a pad and starts feeling like a room.
Here's the thing we tell every homeowner during the design phase: almost nobody wishes they'd gone smaller. We hear "I wish we'd made it bigger" ten times for every "it's too big." That's worth keeping in mind when you're planning your perfect patio.
Most Requested Add-On Features
A patio by itself is a slab. It's the features that turn it into a space you actually use. Here's what homeowners add, ranked by how often they show up in our projects.
| Feature | % of Projects |
|---|---|
| Seat wall | 52% |
| Fire pit | 47% |
| Steps/stairway | 44% |
| Landscape lighting | 38% |
| Retaining wall | 33% |
| Outdoor kitchen | 22% |
| Pergola/shade structure | 18% |
| Water feature | 6% |
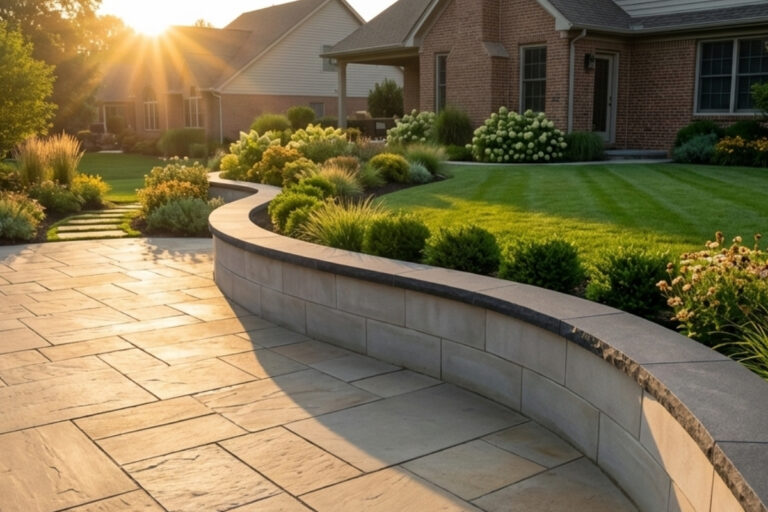
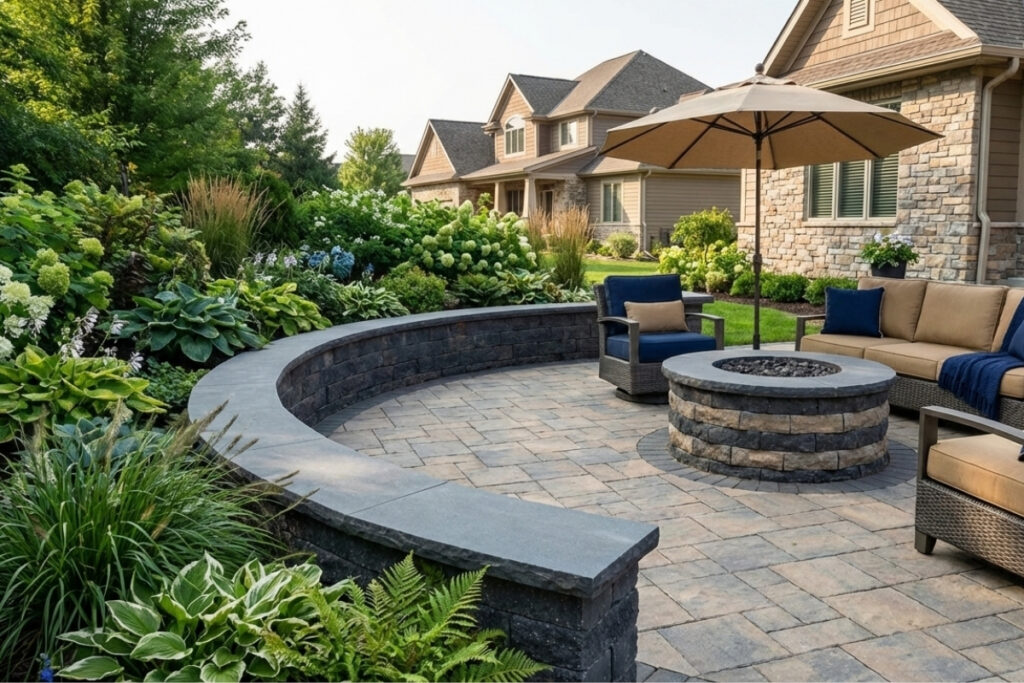
Seat walls top the list. They're functional — extra seating without dragging out more chairs — and they define the patio's edges in a way that looks intentional. Roughly half our projects include one.
Fire pits are close behind at 47%. No surprise there. In Northeast Ohio, a fire pit extends your patio season by weeks on each end. Some of our clients are out there in October, November even, because that fire pit makes it possible.
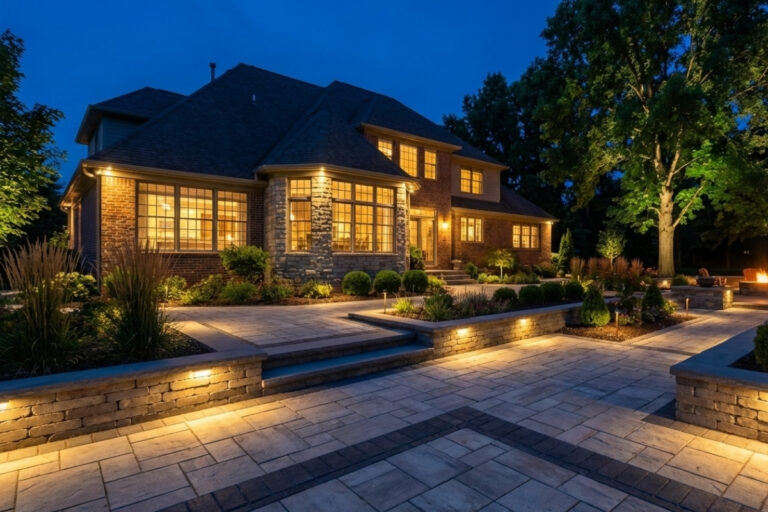
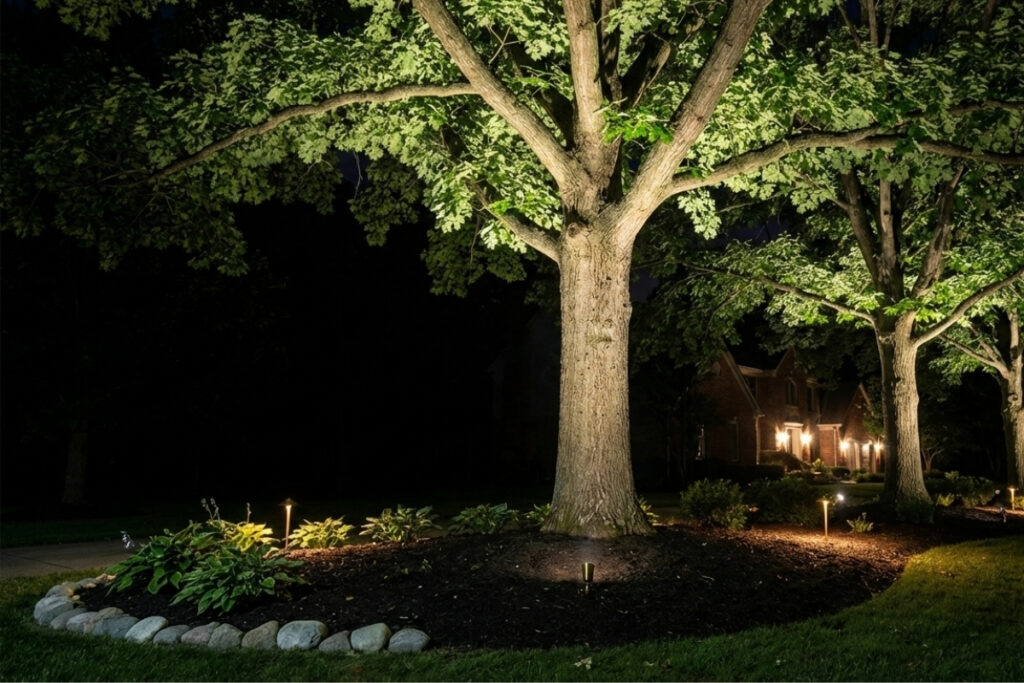
Landscape lighting at 38% is one I always push for. It's the feature with the highest satisfaction rate in our follow-up conversations. Homeowners who skip it almost always call back within a year wanting to add it.
Outdoor kitchens have climbed to 22%. According to the National Association of Realtors, outdoor living features consistently rank among the top home improvements for perceived value, and a well-built outdoor kitchen anchors a space like nothing else.
Cost Distribution: What Homeowners Actually Spend
Money. The part everyone wants to know about and nobody wants to talk about. Here's what our actual project costs look like.
| Investment Range | % of Projects |
|---|---|
| Under $15,000 | 12% |
| $15,000–$25,000 | 28% |
| $25,000–$40,000 | 32% |
| $40,000–$60,000 | 18% |
| $60,000+ | 10% |
The average project lands around $32,000. The largest cluster — 32% — falls in that $25K to $40K range. That typically gets you a 400–600 square foot paver patio with a seat wall, fire pit, steps, and lighting.
One pattern I've noticed over two decades: homeowners almost always spend more than their initial number. Not because we upsell. Because once they see the design and understand what's possible, they choose to invest in features they hadn't considered. The jump from a $20K patio to a $30K patio isn't about size — it's about adding a seat wall here, upgrading the paver selection there, integrating lighting throughout. Each addition is a deliberate choice.
For a detailed breakdown of what drives those numbers, we put together a full guide on patio costs in the Cleveland area.
Paver Color and Pattern Preferences
Design trends come and go. Our data shows homeowners consistently lean toward what works with their home's existing palette rather than chasing what's new.
Color Families:
| Color Family | % of Projects |
|---|---|
| Earth tones (tan, brown, warm gray) | 45% |
| Gray tones (charcoal, silver, slate) | 35% |
| Mixed/blended | 15% |
| Bold colors | 5% |
Earth tones lead, but gray tones have gained serious ground. Five years ago, warm tones accounted for 60% or more. The shift toward cooler grays mirrors what Belgard and other manufacturers have seen nationally — modern and transitional home styles pull naturally toward those charcoal and slate palettes.
Laying Patterns:
| Pattern | % of Projects |
|---|---|
| Herringbone | 38% |
| Running bond | 28% |
| Random/ashlar | 22% |
| Basketweave | 12% |
Herringbone remains king at 38%. It's not just about aesthetics — herringbone provides the strongest interlock, which matters for patios that see foot traffic, furniture, and the occasional wheelbarrow during fall cleanup.
Seasonal Timing: When Projects Happen
If you're wondering when to start the process, here's what our calendar actually looks like.
Design consultations peak: February through April. Homeowners start thinking about their backyard right around the time cabin fever hits hardest. Smart move — getting into the design queue early means you're first in line for spring construction.
Construction starts peak: May and June. Ground conditions in Northeast Ohio usually cooperate by mid-April, but the bulk of our starts cluster in those two months.
Median project timeline: 6 to 8 weeks from design start to completion. That includes the design process, material selection, permitting if needed, and the build itself. The construction portion alone typically runs 1 to 3 weeks depending on complexity.
The homeowners who plan ahead — calling in February for a June patio — have the smoothest experience. The ones who call in June wanting it done by the Fourth of July? That's a tougher conversation.
What the Data Tells Us
Looking back at tons of work, some things stand clear. Patterns show up without warning.
Homeowners pick what works, not just what's new. Fifty-eight percent go with concrete pavers, while earth tones show up in nearly half of projects. Herringbone patterns appear about one out of every three times. You won’t find these pushed hard by trends online. These happen during life stages where cash, property, and long-term consequences are at stake. Choices arrive tied to decades of outcome.
Most people spend beyond their first estimate. Not due to poor budgeting – it comes from thoughtful choices about additions that enhance real use of the area. That idea shows up plainly in the data from $32K’s findings.
Few people ever think they should have done more. At 450, we sit right in the middle – proof enough. Those who built between 400 and 600 usually feel best about their choices. Under 300, people begin sharing their doubts.
Fire changes how a patio looks. One out of every three ideas we see includes a fire circle with ground lights. People who add those features tend to sit outside later, often throughout different seasons.
What you see comes straight from actual work, people building homes, choices being made on the ground in Northeast Ohio. When you plan something yourself, these figures offer a base – not a hard law, but real-world proof of how things tend to go.
Ready to Start Your Project?
Maybe start by talking through what your backyard looks like. Your intentions matter too – what you hope to achieve there. Even small steps begin somewhere real.
Here's a thought on Request Your Design Consultation – maybe we explore options fitting well with how you live.